BMW market share statistics tell a mixed story: the group shipped fewer vehicles in 2024, but it kept growing in electrification, defended premium leadership in key markets, and posted striking gains in select nameplates.
The numbers point to a brand that is not merely chasing volume, but reshaping its mix.
From Europe to the UK, and from X-series SUVs to the fast-expanding BEV lineup, the latest figures show where BMW is winning share, where it is losing momentum, and which markets are doing the heavy lifting.
At a glance: BMW market share statistics
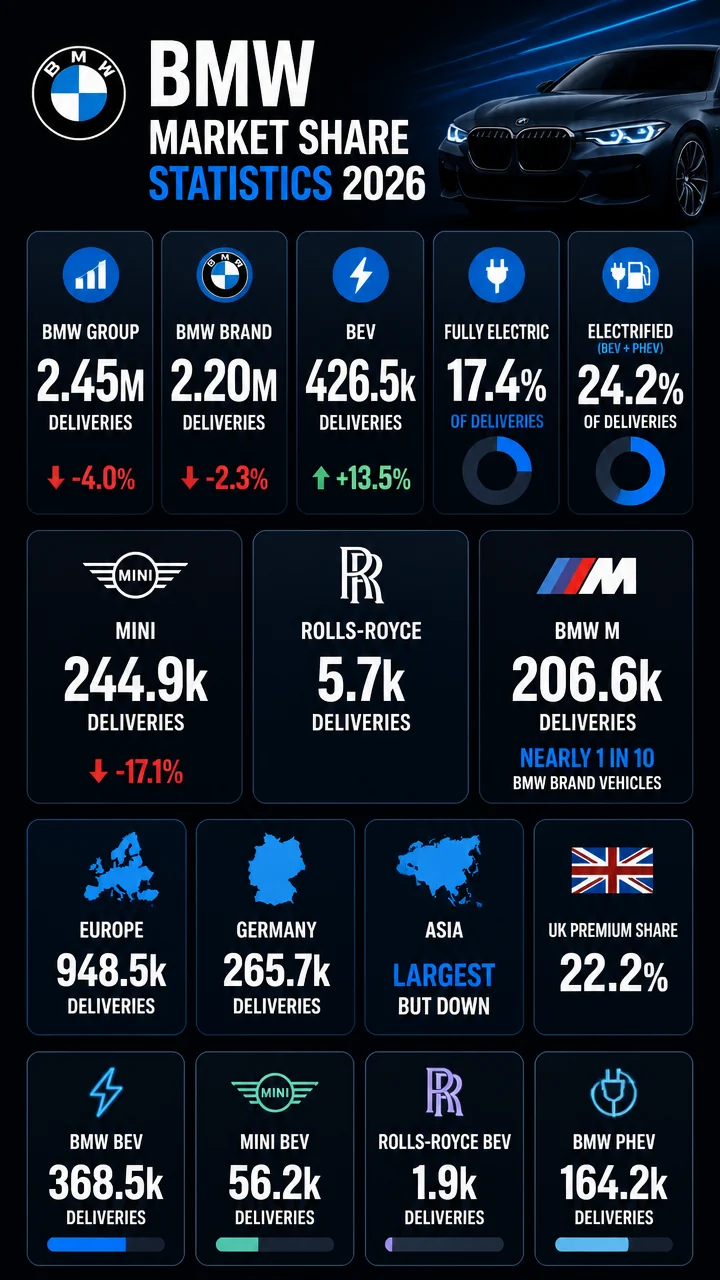
- BMW brand deliveries reached 2,200,217 in 2024.
- BMW Group BEV deliveries climbed to 426,536.
- BMW’s UK premium sector share was 22.6% in 2024.
- Asia remained the largest region by volume, but it fell sharply year over year.
- BMW M delivered 206,587 vehicles, nearly 1 in 10 BMW brand vehicles.
BMW market share statistics: the core delivery picture
BMW Group delivered 2,450,854 vehicles in 2024, a decline of 4.0% from 2,554,183 in 2023.
That slowdown matters because it shows the group’s overall market share pressure is not isolated to one brand or one region.
The BMW brand itself was more resilient.
BMW brand deliveries totaled 2,200,217 in 2024, down 2.3% from 2,252,793 a year earlier.
MINI was the weak spot in the portfolio, falling 17.1% to 244,925 deliveries, while Rolls-Royce declined 5.3% to 5,712.
| Brand / Group | 2024 deliveries | YoY change |
|---|---|---|
| BMW Group | 2,450,854 | -4.0% |
| BMW brand | 2,200,217 | -2.3% |
| MINI | 244,925 | -17.1% |
| Rolls-Royce | 5,712 | -5.3% |
BMW market share statistics by electrification and EV mix
The biggest growth signal in BMW market share statistics is electrification.
BMW Group BEV deliveries reached 426,536 in 2024, up 13.5% from 375,716 in 2023.
Electrified deliveries, which include BEVs and PHEVs, totaled 593,150, up 4.8% year over year.
That pushed fully electric vehicles to 17.4% of BMW Group deliveries, up from 14.7% in 2023.
Electrified vehicles reached 24.2% of BMW Group deliveries, up from 22.2% the year before.
- BEVs: 426,536 deliveries in 2024
- Electrified vehicles: 593,150 deliveries in 2024
- Fully electric share: 17.4%
- Electrified share: 24.2%
Within the BMW brand, BEV deliveries rose to 368,475, up 11.6% from 330,197.
BMW PHEV deliveries moved in the opposite direction, falling 5.6% to 164,172.
That combination suggests BMW is leaning more heavily into battery-electric growth than plug-in hybrid expansion.
| Electrified metric | 2024 | YoY change |
|---|---|---|
| BMW Group BEV deliveries | 426,536 | +13.5% |
| BMW Group electrified deliveries | 593,150 | +4.8% |
| BMW BEV deliveries | 368,475 | +11.6% |
| BMW PHEV deliveries | 164,172 | -5.6% |
“Fully electric vehicles were 17.4% of BMW Group deliveries in 2024.”
That share is especially important because it shows BMW’s electrification momentum is now large enough to influence the entire group’s market position, not just a niche part of it.
BMW market share statistics by region
BMW’s regional data shows a company with strong positions in Europe and the UK, steady volume in the Americas, and a sharp decline in Asia.
Asia was still the largest region by volume in 2024 at 963.6 thousand deliveries, but it fell from 1,073.1 thousand in 2023.
China, the largest country market in the dataset, also declined materially.
| Region | 2024 deliveries | 2023 deliveries | Trend |
|---|---|---|---|
| Europe | 948.5k | 943.0k | Up |
| Germany | 265.7k | 272.6k | Down |
| UK | 168.8k | 159.2k | Up |
| The Americas | 482.7k | 482.0k | Flat |
| USA | 399.3k | 397.3k | Up |
| Asia | 963.6k | 1,073.1k | Down |
| China | 715.2k | 826.3k | Down |
| Other markets | 56.1k | 56.1k | Flat |
Europe accounted for 948.5 thousand BMW Group deliveries in 2024, up slightly from 943.0 thousand in 2023.
The brand explicitly said BMW expanded market share primarily in Europe, which makes Europe the clearest regional bright spot in the current data.
The UK also stood out.
BMW Group deliveries in the UK reached 168.8 thousand, up from 159.2 thousand, while the broader BMW Group UK release showed 172,240 combined BMW and MINI registrations, up 8% year over year.
BMW market share statistics in the UK premium market
The UK is one of the most useful markets for understanding BMW market share statistics because the release includes both volume and share.
In 2024, BMW’s share of the UK premium sector was 22.6%, and BMW secured 20.4% of the total premium BEV market.
That is a strong indicator of premium-market power: BMW is not only moving vehicles, it is controlling a meaningful slice of the most profitable category in the market.
- BMW Group UK combined BMW and MINI registrations: 172,240, up 8%
- BMW brand UK registrations: 125,265, up 12%
- BMW BEV registrations: 33,785, up 18%
- BMW BEVs as share of BMW UK registrations: 26.9%
- MINI UK registrations: 46,975, down 1%
- BMW M registrations in the UK: 17,191, up 7%
The model-level detail makes the UK especially revealing.
BMW i4 registrations hit 12,953, up 45% year over year.
BMW i5 registered 3,825 in its first full sales year, while BMW iX1 reached 5,790 and BMW iX2 reached 2,819 in its first ten months on sale.
“BMW secured 20.4% of the total premium BEV market in the UK in 2024.”
That share suggests BMW’s EV transition is helping protect its premium positioning rather than diluting it.
BMW market share statistics by model line
BMW’s portfolio data shows where the brand is really concentrated.
A few core nameplates dominate deliveries, with SUVs and the 3 Series family doing most of the work.
| BMW model line | 2024 deliveries | % of BMW deliveries | YoY change |
|---|---|---|---|
| 3 Series / 4 Series | 519,228 | 23.6% | -7.0% |
| X1 / X2 | 413,386 | 18.8% | +30.0% |
| X3 / X4 | 370,198 | 16.8% | -8.7% |
| X5 / X6 | 275,318 | 12.5% | -1.9% |
| 5 Series / 6 Series | 250,674 | 11.4% | -8.5% |
| 1 Series / 2 Series | 198,226 | 9.0% | -12.2% |
| X7 | 59,949 | 2.7% | -1.9% |
| 7 Series / 8 Series | 56,542 | 2.6% | -5.4% |
| iX | 38,365 | 1.7% | -24.8% |
| XM | 7,813 | 0.4% | +15.8% |
| Z4 | 10,482 | 0.5% | -4.3% |
| i3 / i8 | 36 | ~0.0% | -95.2% |
The 3 Series/4 Series remained BMW’s biggest line at 519,228 deliveries, representing 23.6% of BMW deliveries.
But the real growth story was X1/X2, which surged 30.0% to 413,386 and nearly matched the 3 Series family in scale.
Several patterns stand out:
- SUVs are the volume engine. X1/X2, X3/X4, X5/X6, and X7 together account for a major share of deliveries.
- Upper-end sedans are under pressure. The 5 Series/6 Series and 7 Series/8 Series both declined.
- BMW’s EV halo is uneven. iX fell 24.8%, but i4 and iX1 momentum in the UK shows the portfolio still has traction.
- Performance can still break through. XM rose 15.8%, even from a relatively small base.
BMW M market share statistics and performance-car demand
BMW M is a useful proxy for brand desirability because it sits at the top of the BMW lineup.
BMW M delivered 206,587 performance and high-performance vehicles in 2024, up 2.1% from 202,431 in 2023.
BMW Group said M deliveries were almost 1 in 10 BMW brand vehicles, which is a powerful statement about how deeply performance trims are embedded in the BMW mix.
- BMW M global deliveries: 206,587
- BMW M UK registrations: 17,191
- BMW M2 UK registrations: 1,505, up 101%
- BMW XM UK registrations: up 184%
The UK data is especially strong for M.
Growth in M2 and XM points to a market where BMW’s high-performance identity continues to convert into registrations, not just awareness.
BMW market share statistics for MINI: the weak link in the portfolio
MINI remains strategically important, but the 2024 numbers show clear pressure.
MINI deliveries fell to 244,925, down 17.1% from 295,358 in 2023.
The brand’s model mix helps explain why.
MINI Hatch delivered 128,635 units, down 17.3%, but still represented 52.5% of MINI deliveries.
Countryman held up better at 80,971 units, down just 2.9% and equal to 33.1% of MINI deliveries.
| MINI model | 2024 deliveries | % of MINI deliveries | YoY change |
|---|---|---|---|
| Hatch | 128,635 | 52.5% | -17.3% |
| Countryman | 80,971 | 33.1% | -2.9% |
| Convertible | 18,994 | 7.8% | -40.9% |
| Clubman | 10,693 | 4.4% | -55.8% |
| Aceman | 5,632 | 2.3% | N/A |
The most striking MINI figure is the collapse in older nameplates.
MINI Clubman deliveries fell 55.8% and MINI Convertible deliveries dropped 40.9%.
Meanwhile, MINI BEV deliveries rose 24.3% to 56,171, suggesting the brand’s electric transition is still building a base even as legacy lines shrink.
BMW market share statistics in Latin America
Latin America is a smaller volume story than Europe or Asia, but the growth trend is notable.
In the first half of 2024, BMW Group delivered 20,678 BMW cars in Latin America, up 13.8% from the same period in 2023.
MINI added 3,344 deliveries, up 1%.
BMW described itself as the preferred premium brand in the region and said it remained leadership-positioned in the premium automotive segment.
That language matters because it signals share strength even where the dataset does not provide a direct percentage.
- Brazil BMW sales: 7,646, up 20.1%
- Brazil MINI sales: 883, up 26%
- Mexico BMW sales: 7,058, up 16.6%
- Mexico MINI sales: 1,695, up 0.3%
- Argentina BMW sales: 495, up 44.7%
Brazil and Mexico account for the clearest growth signals, while Argentina posted the fastest rate of increase in the group’s disclosed Latin American markets.
BMW market share statistics: 2024 vs 2023 momentum check
Some of BMW’s most important market share movements show up in the year-over-year comparisons.
The pattern is not uniform, which is exactly what makes the data interesting.
- Up: BMW Group BEVs (+13.5%)
- Up: BMW BEVs (+11.6%)
- Up: BMW M (+2.1%)
- Up: UK BMW registrations (+12%)
- Up: BMW X1/X2 (+30.0%)
- Down: BMW Group total deliveries (-4.0%)
- Down: MINI deliveries (-17.1%)
- Down: China deliveries (-13.2% in the first nine months)
- Down: BMW iX (-24.8%)
The clearest split is between electrified growth and legacy-pressure declines. BMW is gaining momentum in battery-electric products and selected premium markets, while total volume is being restrained by weakness in parts of Asia and the MINI line.
What the BMW market share statistics say about 2026
Based on the latest available figures, BMW enters 2026 with a market-share profile built on three strengths: a resilient core BMW brand, rising EV penetration, and strong premium-market positioning in markets such as the UK and parts of Europe.
The risks are equally clear: overall group volume slipped in 2024, Asia and China weakened, and MINI posted a steep decline.
Still, the dataset shows a company with enough brand power to grow share in key premium segments while the product mix shifts rapidly toward electrification.
- BMW Group remains above 2.4 million annual deliveries despite a 4.0% dip.
- BMW brand performance is stronger than MINI and closer to stability.
- Electric vehicles are now a meaningful share of the total business, not an experimental side line.
- Europe and the UK are the clearest share-strength markets.
- X1/X2 is one of the most important growth engines in the BMW portfolio.
“BMW expanded market share primarily in Europe.”
That single line captures the broad direction of the brand’s current market-share story: slower total growth, stronger regional positioning where it matters most, and a product mix increasingly anchored by electrification and SUVs.